Many studies have revealed that Americans are very dissatisfied with government, especially Congress. But why are they so dissatisfied and what can Members of Congress do to restore confidence? The Program for Public Consultation (PPC) undertook an in-depth study with over 4,000 voters to try to answer these questions, building on previous studies.
PPC’s in-depth study, “The Demand for Public Consultation,” finds that large bipartisan majorities of voters want Members of Congress to consult their constituents on key policy decisions using new public consultation tools, and to take the recommendations of their constituents – as a whole – into account when voting on policies.
The survey reveals widespread dissatisfaction with the current relationship between Members of Congress and the public, as well as high levels of distrust in government. The public perceives that elected officials are not reflecting the will of the people, which is fueling that distrust. The study sought to address how voters would assess a Congressional candidate who commits to listening to the views of a representative sample of their constituents who go through online public consultations on policy matters.
The survey was fielded July 13 – September 15, 2021, with a sample of 4309 registered voters. The margin of error was +/-1.5% for questions that were asked to the entire sample. Most questions went to partial samples for which the margin of error was higher--in most cases in the 3-5% range.
The survey was conducted online with a sample provided by Nielsen Scarborough from its larger probability-based panel recruited by telephone and mail. The sample was subsequently weighted using benchmarks from the American Community Survey, including age, gender, race/ethnicity, education, and geographic division. The survey was also weighted by partisan affiliation.
Widespread Voter Dissatisfaction with Elected Representatives’ Responsiveness to the People
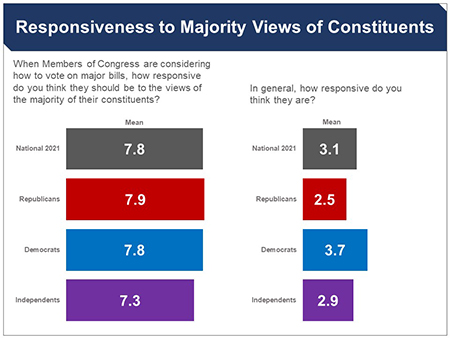 Asked how responsive Members of Congress should be to the views of their constituents on a 0-10 scale the mean response was 7.8. Asked how responsive they are, the mean response was 3.1. Comparing the two responses, an overwhelming majority of 82% said MoCs should be more responsive than they are, with no significant partisan differences.
A separate sample was asked “As a general rule, when Members of Congress are considering how to vote on major bills, how much do you think they should take into account the views of the majority of their constituents?” using a scale of 0-10. Similar to above, the mean response was 7.6. Asked how much they do take into account constituent views the mean response was 3.7. 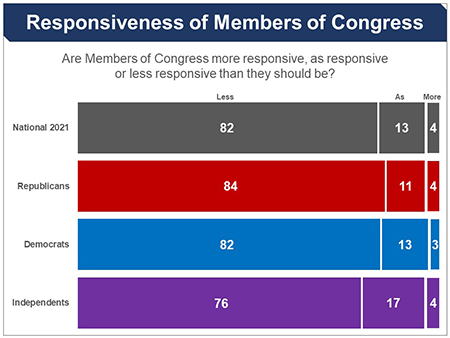 The percentage indicating MoCs should take the views of constituent into account more than they do was 73%, with little partisan difference.
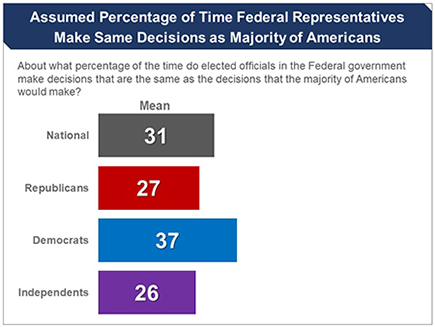
When asked to estimate what percentage of time “elected officials in the federal government make decisions that are the same as the decisions that the majority of Americans would make,” the average respondent said just 31 percent of the time. The average Republican said 27%, the average Democrat 37%, and the average independent 26%.
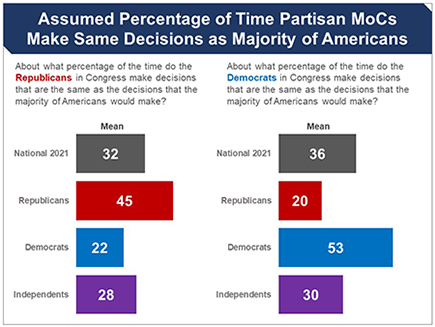
Asked specifically about Republican and Democratic Members of Congress, the overall perception is still that they follow the public’s will only about one-third of the time. Even when evaluating MoCs of their own party, partisans rated their own party as being aligned with the majority no more than a bare majority of the time (Republicans 45%, Democrats 53%).
Public Influence and the Founders’ Vision
When asked to think about the Founders observing today’s government, 79% said the Founders would believe that the US government is not doing a good job fulfilling the vision they had.
This view was held by large majorities of both parties. However, in this survey views were more negative among Republicans (92%) than Democrats (67%). On the other hand, when this question was asked in 2018 when Republicans controlled Congress and the White House, Democratic views were more negative (91%) and Republicans less so (79%).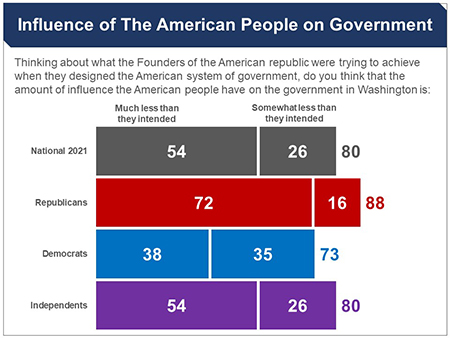 More specifically, a large bipartisan majority says that the people have less influence on the government than the Founders intended. Overall, 80% feel that people have less influence on the government than what the Founders intended–up 10 points from 2018–with 54% saying “much less.” Nearly nine in ten Republicans share this view, with an overwhelming majority of 72% saying much less. Seventy-three percent of Democrats concur, as do eight in ten independents.
Interestingly, the share of Republicans and independents holding this view increased by 17 points and 16 points, respectively, since 2018, while the percentage of Democrats remained nearly identical.
Government Seen as Serving Special Interests Over Common Good
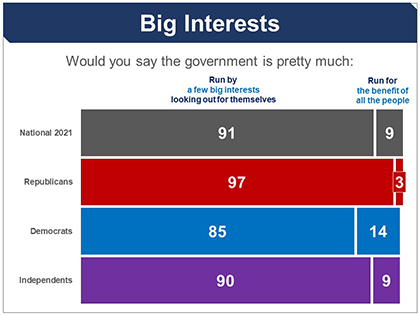
An overwhelming bipartisan majority of 91% say that the government is “run by a few big interests looking out for themselves,” (Republicans 97%, Democrats 85%, independents 90%); rather than being “run for the benefit of all the people,” (9%, Republicans 3%, Democrats 14%, independents 9%).

 Members of Congress (MoCs) are widely seen as frequently prioritizing donors over the good of the country, with eight-in-ten saying they do so often (37%) or nearly always (44%). Eighty-five percent of Republicans agree, as do 78% of Democrats and 76% of independents.
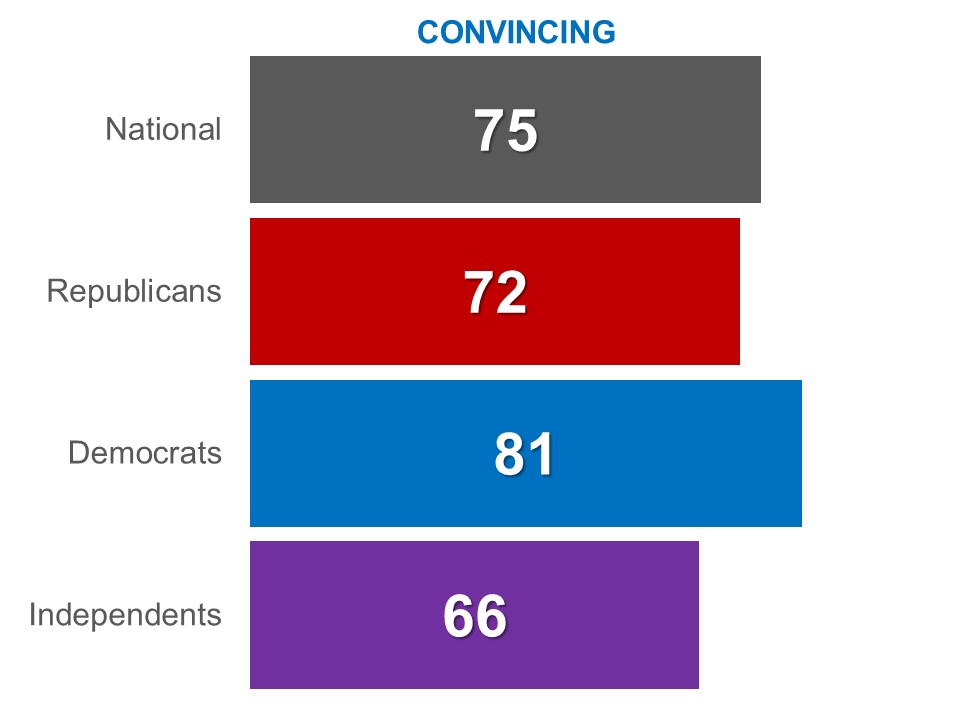
Overall, the percentage of people who feel this way has remained relatively unchanged since 2018. However, the percentage of Republicans saying “nearly always” increased nine points over the three years, while the percentage of Democrats decreased a remarkable 23 points. There was no shift among independents. A bipartisan majority of 64% believes that their Congressional representatives have little interest in the views of their constituents (64%, Republicans 69%, Democrats 55%, independents 72%). 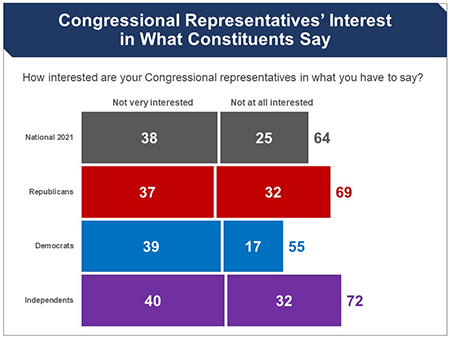 Consistently, a very large bipartisan majority (75%) says that elected officials in the Federal government understand the views of most Americans not very well (44%) or not well at all (31%). Large majorities of partisans agreed (Republicans 86%, Democrats 65%, independents 79%). Compared to 2018, substantially more voters have come to believe that representatives are not interested in what they have to say.
The Inadequacy of System for Hearing Public
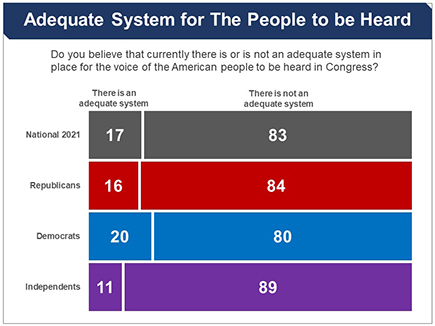
Eighty-three percent believe that there is not currently “an adequate system in place for the voice of the American people to be heard in Congress,” with little partisan difference (Republicans 84%, Democrats 80%, independents 89%).
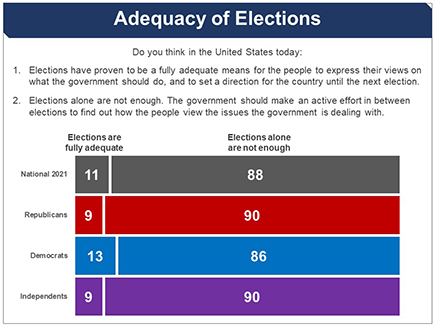
Respondents were asked more specifically about the adequacy of elections as a means for representatives to understand their constituents’ views. Given two options, just 11% chose, “Elections have proven to be a fully adequate means for the people to express their views on what the government should do, and to set a direction for the country until the next election,” while an overwhelming 88% chose, “Elections alone are not enough. The government should make an active effort in between elections to find out how the people view the issues the government is dealing with.” Partisan responses were very similar, with 90% of Republicans and 86% of Democrats saying elections alone are not adequate.
Support for Seeking Bipartisan
Common Ground of the People
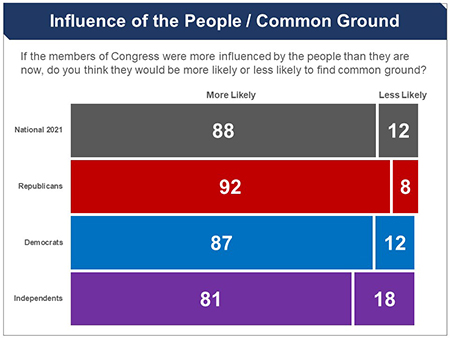 Respondents were asked if MoCs were more influenced by “the people” than they are now whether they would be more or less likely to find common ground. An overwhelming bipartisan majority of 88% said more likely (Republicans 92%, Democrats 87%, independents 81%).
A separate sample was asked a different form of the question that asked respondents to choose between arguments: one said that, in regard to gridlock in Congress, “listening to the views of the people would not help, because the gridlock in Congress is just a reflection of the polarization among the people,” while the other said “if Congress would listen to the views of the people as a whole this would help break the logjam, because the people are less polarized than Congress. The latter position was chosen by a bipartisan 73% (Republicans 74%, Democrats 71%, independents 74%).
Respondents were also asked who they believe has more common sense: the American government or the American people. Eighty-one percent chose the American people, including 91% of Republicans and 85% of independents. Among Democrats, a smaller but still very large majority of 71% agreed.
 Whether MoCs Should Respond to All Constituents or Their Supporters
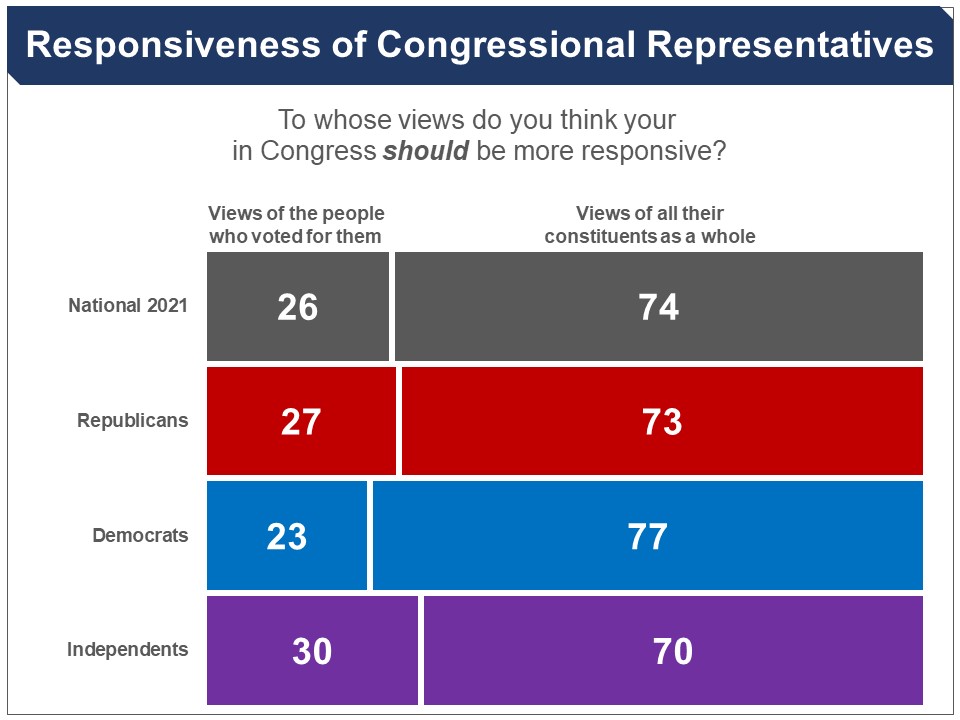
A bipartisan three-in-four believe that MoCs should be more “responsive” to the views of “all their constituents as a whole” (Republicans 73%, Democrats 77%) rather than the views of only “the people who voted for them” (26%). This is up six points since 2018.
From 2018 to 2021, the percentage of Republicans who believe MoCs should be responsive to just the views of their voters decreased from 42% to 27%. However, there was no shift among Democrats over that period.
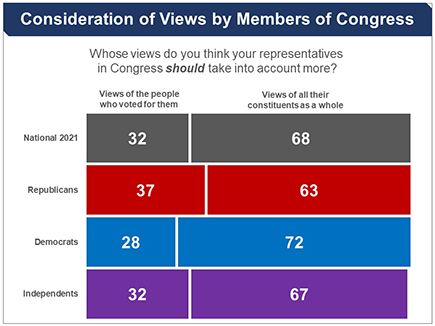
Respondents were also posed with a similar question, about whose views MoCs should “take into account” more. Overall, 68% said the views of all of their constituents (Republicans 63%, Democrats 72%) and just 32% said just the views of their own voters. Since 2018, the percentage favoring overall representation has risen by nine points.
Asked whose views they would prefer to have the most influence on the government–the views of the majority of the public as a whole or the views of Republicans or Democrats–70% said the views of the majority of the public as a whole, rather than the views of the majority of Republicans (15%) or the majority of Democrats (14%). Around two-thirds of partisans said the views of the public (Republicans 64%, Democrats 67%), as did nine-in-ten independents.
Similarly, a large bipartisan majority of 71% said that the majority of the public as a whole is most likely to show the greatest wisdom on questions of what the government should do (Republicans 69%, Democrats 67%), rather than the majority of Republicans (13%) or Democrats (1 5%).
The latter two questions were asked in a 1999 survey and the responses are very similar to today.

Readiness to Vote for Congressional Candidate
Who Would Use New Tools for Public Consultation
To find out how voters are likely to respond to a candidate who commits to public consultation, respondents were first divided according to whether in the upcoming election in 2022 they have:
- an open House or Senate seat in their state or district;
- a House incumbent who is likely to run for re-election;
- a Senate incumbent who is likely to run for re-election.
They were then asked to imagine that there is a candidate who makes a pledge to public consultation.
- For the open seat the public consultation candidate was presented as Republican for half of the respondents and Democratic for the other half.
- For those with a House or Senate incumbent running, the public consultation challenger was presented as being of the opposite party.
Respondents were asked to imagine that the candidate made the following statement:
| CAMPAIGN PLEDGE TO CONSULT CONSTITUENTS |
|
I think it is very important for Members of Congress to listen to and be guided, not by special interests or big campaign donors, but by the people they represent. This country was founded on the idea that elected officials should listen closely to the people. Today I am making a pledge. If I am elected, I pledge to consult with my constituents on major issues before Congress and to take their views into account when deciding how to vote. I commit to listen to the people over special interests or campaign donors. Though I am a [Republican/Democrat], I will put a higher priority on the views of the people I represent than the views of the party leadership. I believe the people have common sense and their voice should be at the table when important decisions are being made. Now lots of candidates say they listen to the people. But I am taking another step. I will work with a university-based survey research center that will consult the people in my [district /state] in a scientific way. Here is how it will work. The university program will recruit a large panel of several hundred citizens that is representative of the people in the [district /state]. That means the panel mirrors the people in the [district/state] in terms of gender, age, race, education, and political party affiliation. The panel will be consulted on key issues being considered in Congress. Working online, members of the panel will take a survey on these issues. On each issue, they will be:
The survey will be developed by the university survey research center. It will be reviewed by experts—both Republicans and Democrats—and advocates with different points of view, to ensure that the briefing is accurate and balanced, and that the key arguments are fairly presented. Everything will be completely transparent, so that everybody can see exactly what the citizen panel saw. The names of the panel members will not be made public, so no one, including me, can influence their conclusions. Once the panel’s recommendations are summed up, I will be given a briefing on the results. In some cases, I may also meet with some of the members of the panel so I can hear about their thoughts in greater depth. Naturally, in the end, I will need to make the final decision about how to vote. There are some issues I feel strongly about and may go against the majority views in my [district/state]. But I will always pay close attention to the recommendations of the panel, especially when they are supported by majorities of both Republicans and Democrats. And, I will take these views into account when I decide how to vote. |
They were then asked whether they would have a positive or negative view of the candidate making such a pledge. Finally, they were also asked about their likelihood to vote for such a candidate with the following question:
Of course, the vote you make would depend on your view of the actual candidate, but based on what you know, how likely do you think it is that you would vote for a candidate who makes such a pledge?
Open Seats
Respondents who live in areas that will have an open House or Senate seat in the 2022 election were presented a hypothetical candidate who makes the pledge described above. The sample was split, with half evaluating a hypothetical Republican candidate, and half a Democratic one making the pledge.
Among those presented the hypothetical Republican candidate, 67% said that making this pledge would be positive (neither positive nor negative 26%, negative 5%). Among those with the Democratic candidate, 61% said positive (neither 30%, negative 8%).
Partisans also had a positive view of a candidate making the pledge, even when that candidate was from the party opposite their own. Just over half of Republicans said the fact that a Democratic candidate made the pledge would be positive (51%). Among Democrats evaluating the Republican candidate, 70% said it would be positive.
 Likelihood to Vote for Candidate
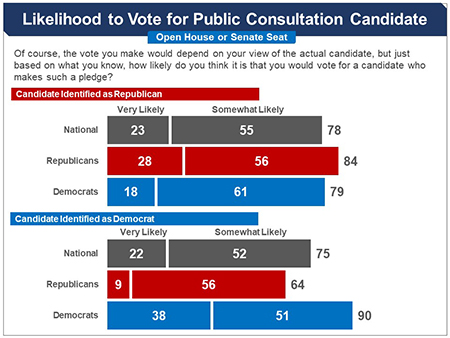
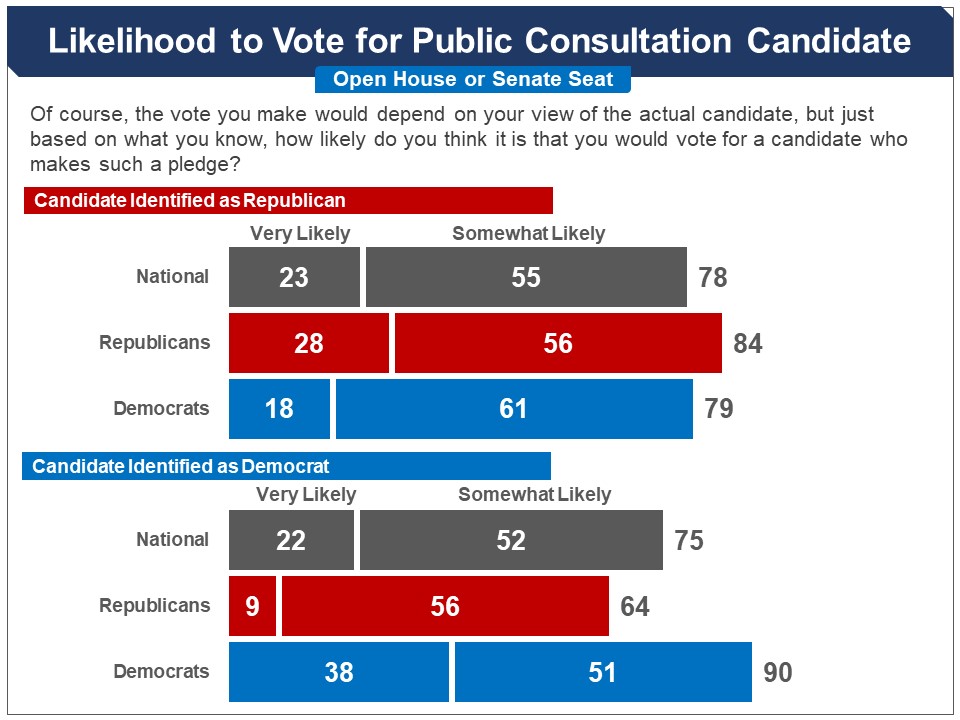
They were then asked about their likelihood to vote for a public consultation candidate. Majorities said they would be likely to vote for such a candidate whether it was identified as Republican (78%, very likely 23%) or Democratic (75%, very 22%).
Of special interest is how many Republicans and Democrats would likely cross party lines vote for a public consultation candidate from the party opposite their own. Over six-in-ten Republicans said they would likely vote for the Democratic candidate (64%), and eight-in-ten Democrats (79%) for the Republican candidate.
Small percentages said it was not very likely (Republicans 24%, Democrats 17%) or not at all likely (Republicans 11%, Democrats 4%) that they would cross party lines.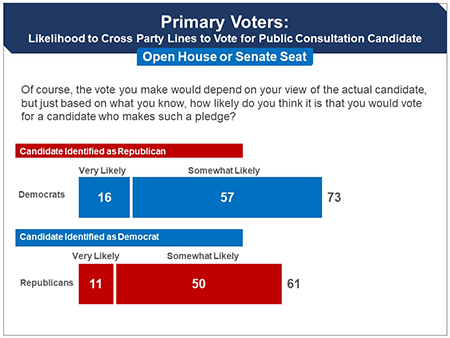
Primary Voters
A separate analysis was done of respondents who report always voting in primaries, as it is generally assumed that primary voters are very loyal to their parties. It should be noted that the pledge from the candidate included the statement suggesting that they might be less responsive to the party leadership:
Though I am a [Republican/Democrat], I will put a higher priority on the views of the people I represent than the views of the party leadership.
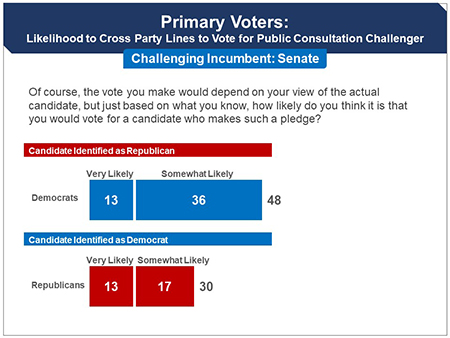
Substantial majorities of partisans said they would be likely to cross party lines to vote for such a candidate: for Republicans 61% (very 11%), for Democrats 73% (very 16%). This was just three and six percentage points, respectively, lower than for the general sample (Republicans 64%, Democrats 79%).
Challenging a House Incumbent
A set of respondents were selected who have a House incumbent likely to run for re-election in 2022. Respondents were asked a series of questions intended to evoke a clear and full picture of their incumbent. They were asked:
- how familiar they were with their incumbent,
- whether they have a positive or negative view of the incumbent,
- whether they voted for the incumbent in the 2020 Congressional election,
- how responsive they feel that incumbent is to constituents.
They were then presented a hypothetical challenger who has made a pledge to systematically consult their constituents Those with a Republican House incumbent were presented a Democratic challenger, and those with a Democratic House incumbent were presented a Republican challenger.
They were asked whether the fact that the candidate made the pledge would be positive or negative, or neither positive nor negative.
- Evaluating a Republican public consultation challenger, a large majority (61%) said that making the pledge would be positive, including a large majority of Democrats (64%), as well as Republicans (67%).
- Evaluating a Democratic public consultation challenger nearly six-in-ten (58%) said making the pledge would be positive, including eight-in-ten Democrats. Among Republicans, a plurality of 47% had a positive view, with 40% choosing neither positive nor negative, and just 13% negative.
 Likelihood to Vote for Challenger to House Incumbent
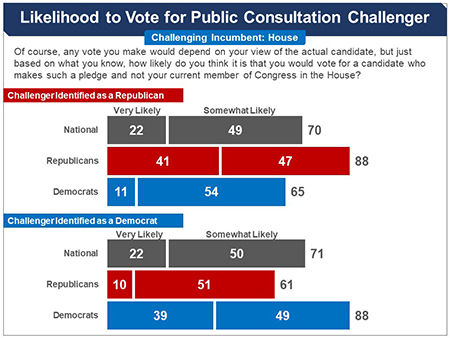
Respondents were then asked about their likelihood to vote for such a public consultation candidate rather than their incumbent House Member. Overall, 70% said they would likely vote for the Republican challenger (very 22%, somewhat 49%), and 71% for the Democratic challenger (very 22%, somewhat 50%).
Particularly relevant, large majorities of partisans from both parties said they would likely cross party lines to vote for the public consultation challenger: 61% of Republicans would likely vote for the Democratic challenger (very likely 10%), and 65% of Democrats for the Republican challenger (very likely 11%).
Eighty-eight percent of both Republicans and Democrats said they would be likely to vote for the challenger from their own party.
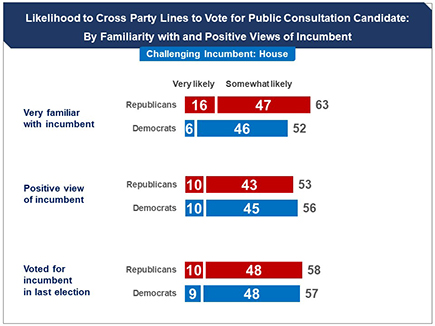
Voters Who are Familiar with and Have Positive Views of House Incumbent
Among voters who were familiar with or had positive views of the incumbent, there was less readiness to cross party lines and vote for a public consultation challenger of the party different from their own, but still majorities said they would likely do so.
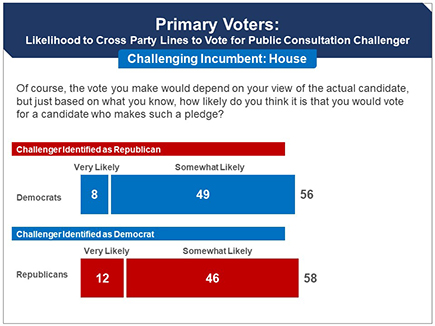
Primary Voters
A separate analysis was done of respondents who report always voting in primaries. Even within this more partisan group, making the pledge to systematically consult constituents improves challengers’ chances of getting people to cross partisan lines.
Majorities of primary voters said they would be likely to cross party lines to vote for the challenger: 58% of Republicans (very 12%) and 56% of Democrats (very 8%). This was only two and nine percentage points, respectively, lower than for the general sample (Republicans 61%, Democrats 65%).
Challenging Senate Incumbent
A sample was constructed of respondents who have a Senate incumbent likely to run for re-election in 2022. In this case the Senate incumbent was named. Respondents were asked a series of questions intended to evoke a clear and full picture of their incumbent. They were asked:
- how familiar they were with their incumbent;
- whether they have a positive or negative view of the incumbent;
- whether they voted for the incumbent in the 2020 Congressional election;
- how responsive they feel that incumbent is to constituents.
They were then presented a hypothetical challenger who has made a pledge to systematically consult their constituents Those with a Republican Senate incumbent were presented a Democratic challenger, and those with a Democratic Senate incumbent were presented a Republican challenger. For each question, respondents were presented the full name of their incumbent Senator. They were then asked whether the fact that the candidate made the pledge would be positive or negative, or neither:
- Evaluating a Republican public consultation challenger, a large majority (64%) said that making the pledge would be positive, including a majority of Democrats (54%), as well as Republicans (78%).
- Evaluating a Democratic public consultation challenger nearly six-in-ten (59%) said making the pledge would be positive, including 74% of Democrats. Among Republicans, a plurality of 47% had a positive view, with 36% choosing neither positive nor negative, and just 16% negative.
 Likelihood to Vote for Challenger to Senate Incumbent
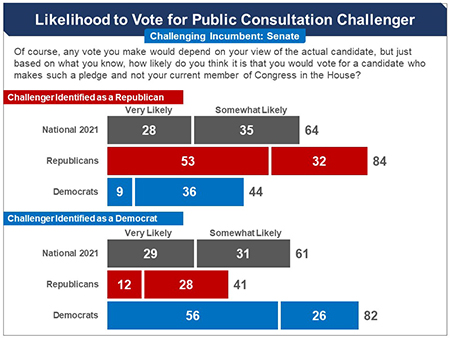
Asked whether they would likely vote for the challenger and not their Senator, whose name was provided to respondents based on their state, majorities said they would be likely to vote for the Republican (64%, very likely 28%) or Democratic challenger (61%, very 29%).
Over four-in-ten respondents would even likely cross party lines to vote for the challenger: 41% of Republicans said they would likely vote for the Democrat and 44% of Democrats for the Republican.
Voters Who are Familiar with and Have Positive Views of Senate Incumbent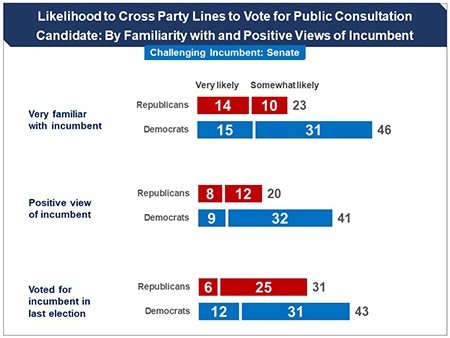 Among voters who were familiar with or had positive views of the incumbent, there was substantially less readiness to cross party lines to vote for the challenger than for the sample as a whole and also less so than in the case of the unnamed House incumbent. Still, substantial minorities said it was likely that they would do so.
Primary Voters
A separate analysis was done of respondents who report always voting in primaries. Even within this more politically active group, making the pledge to systematically consult constituents improves challengers’ chances of getting people to cross party lines.
 About one in three Republican primary voters (30%, very 13%) and nearly half of Democratic primary voters (48%, very 13%) said they would be likely to cross party lines to vote for a public consultation challenger. This was eleven and four percentage points lower, respectively, than for the general sample (Republicans 41%, Democrats 44%).

Candidates Who Support Consulting Constituents:
Attacks & Rebuttals
| ATTACK | REBUTTAL | |
| Too many Americans are emotional, volatile and not all that smart. Most issues are difficult to understand, and a sample of typical Americans would not have the necessary expertise to make sound judgments on policy issues. It would just be a distraction for Members of Congress and interfere with their efforts to solve complex problems. Congress may not be perfect, but they are more reliable than a group of randomly chosen citizens. | The Founders built this country on the principle that nobody knows what’s best for the people better than the people. Consulting citizens is a good idea for the same reason the Founders thought that juries are a good idea. Both are founded on the common sense of ordinary citizens when they are provided with the facts and have a chance to deliberate. Research shows that given correct information the majority of citizens come to conclusions that are reasonable and even show wisdom—probably more than Congress. | |
 |
 |
|
| Members of Congress shouldn’t govern by putting their finger to the wind, reacting to every shift in public opinion. The American people elect Members of Congress to show leadership and make decisions. Doing surveys in their district would make it harder for members of Congress to exercise their independent judgment, make the hard decisions and do what is best for the country-- rather than what they think is popular. | The problem with Congress is not that they’re too reactive to public opinion —it’s that they’re too reactive to special interests. Through in-depth surveys with a large representative sample, I will get advice from people who have heard all sides of an issue and have come to well-considered conclusions that accurately reflect the will of the people. This way we can all be sure that the special interests are not in charge. I think that when the people have accurate and balanced information, they can give valuable advice about what is best for the country. | |
 |
 |
|
| Doing surveys with constituents is not really necessary. When Americans want to make their voice heard they already have lots of options. Besides voting in federal, state, and local elections, they can write letters, attend town hall meetings, sign petitions, join advocacy groups, go to rallies, or walk the halls of Congress. | While Members of Congress make an effort to listen to those self-selected people who are outspoken on an issue, their views often do not reflect how most people think. Organizations and people with money often make a disproportionately loud voice. Hearing from a representative sample of citizens, designed to mirror the district as a whole, will give me a much more accurate read of what the people as a whole really think. | |
 |
 |
|
| This whole effort is really about some outsiders coming in and telling us what the people here think. I don’t believe we can trust this outside group. It can pick and choose the issues it cares about—not us. Who knows what their real agenda is? We can’t be sure that they won’t bias the survey and manipulate people to say what they want them to say. | The plan is for a bipartisan board of experts—with Republicans as well as Democrats—to ensure that the surveys are not biased. They will make sure the topics are the ones being debated in Congress; ensure that the briefings in the survey are accurate and balanced; and ensure that arguments presented are the strongest ones being made and closely reflect what each side is saying. | |
 |
 |
Resilience of Support for Candidate
Committed to Public Consultation
 The Effect on Views of Public Consultation Candidates
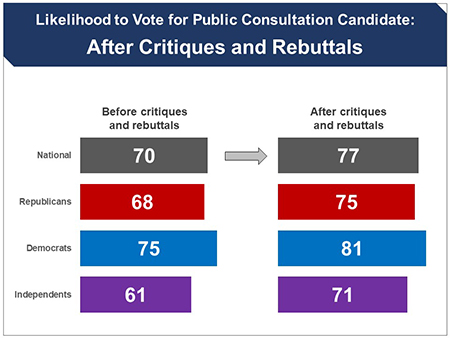
After respondents evaluated the critiques of public consultation and the rebuttals, they were re-asked how likely it is that they would vote for the hypothetical public consultation candidate.
The results from respondents in all three election scenarios were aggregated to determine the total change in respondents’ likelihood to vote for a public consultation candidate. Overall, the percentage saying they would likely vote for the public consultation candidate increased from 70 to 77%. Among Republicans, this increased from 68 to 75%; and among Democrats, from 75 to 81%, while among independents it rose from 61 to 71%.
The Effect of Seeing Policy Positions Supported By Majorities
Respondents were told “You may be wondering what kinds of conclusions a representative panel of citizens would come to” in a public consultation survey, in which respondents were presented a briefing and evaluated arguments for and against the policy proposal. They were then presented a total of 67 positions that they were told (truthfully) received bipartisan majority support in public consultation surveys, and asked whether they agree or disagree with each.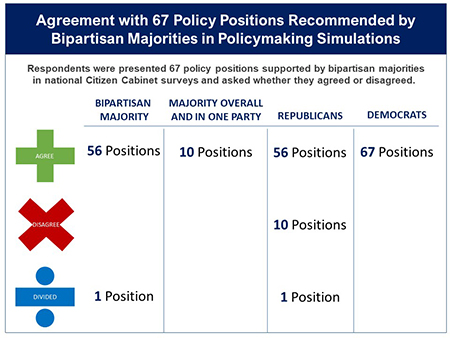
Out of the 67 policies, majorities agreed (strongly, somewhat or lean towards), with 66 of them, and one policy received 50% support. Majorities of Democrats agreed with all of the policies. Among Republicans, majorities agreed with 56 and disagreed with 10; they were divided on one position. This exercise also demonstrates the capacity for public consultation surveys to reveal common ground among the public by providing context, background information, and expert reviewed arguments from both sides. On average, respondents agreed with about three-quarters of the positions.
When respondents in 2018 were presented a different set of positions supported by bipartisan majorities, agreement was almost exactly the same: bipartisan majorities agreed or disagreed with 49 out of 60 policies.
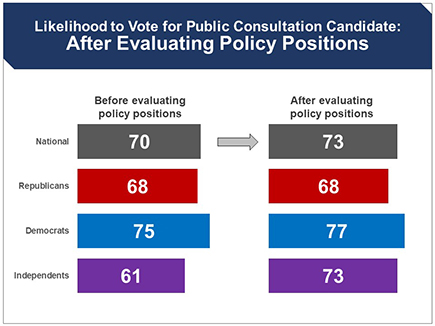
After evaluating the 67 policy recommendations made by bipartisan majorities, they were re-asked how likely it is that they would vote for the public consultation candidate.
Aggregating the results from respondents in all three election scenarios, the percentage that would likely vote for such a candidate increased three points from 70% (very likely 25%) to 73% (very 30%). Among Democrats, it increased from 75% to 77%, with the percentage saying very likely increasing by eight points (28 to 36%). Among independents it increased by twelve points (61 to 73%). Among Republicans, there was no change in the overall percentage saying likely (68%), but there was a four-point increase in those saying very likely (24 to 28%).
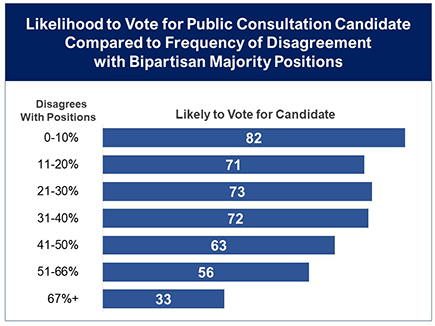
A key question is how the level of disagreement with the positions affects the likelihood to vote for the public consultation candidate. Overall support was quite resilient. Among those who disagreed with just 10% of the positions or less, 82% said they would likely vote for the candidate; and among those who disagreed with 40-50 percent, a large majority of 62% still said they would likely vote for the candidate. Only when respondents disagreed more than 55% of the time did the number saying they would likely vote for the candidate fall below half.
View of Candidate Who Would Endorse Positions
Respondents were asked, “suppose a [Republican/Democratic] candidate were to endorse these recommendations and say that they are positions he or she would likely take if elected.” A bipartisan majority said it would make them more likely to vote for such a candidate (67%, Republicans 56%, Democrats 82%, independents 57%). Another 24% said it would have no effect either way (Republicans 30%, Democrats 15%, independents 33%). Just 8% said less likely.
When respondents were presented a different list of positions in 2018 a higher percentage (81%) said that they would be more likely to vote for the candidate (Republicans 73%, Democrats 89%).
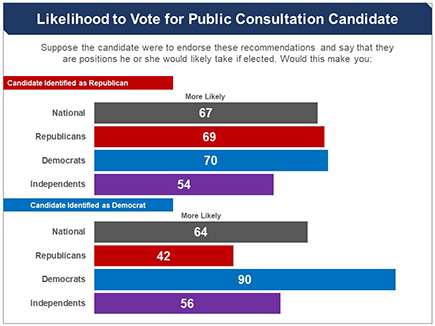

Substantial numbers of partisans would also be more likely to cross party lines if a candidate were to endorse such majority positions. Seven-in-ten Democrats said that if a Republican candidate were to endorse those policy recommendations, they would be more likely to vote for them (much more 36%). Among Republicans, 42% said it would make them more likely to vote for the Democratic candidate, and another 41% said it would have no effect.
Public Assumptions About Level of Agreement With Majority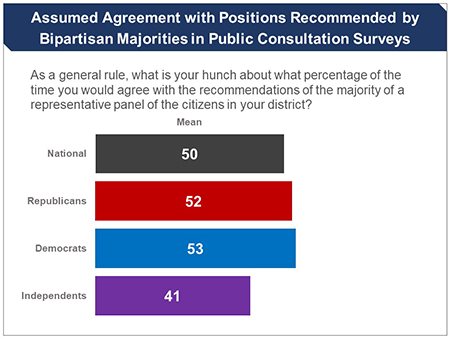 Before respondents evaluated the specific policies recommended by bipartisan majorities, they were asked to estimate what percentage of time they would agree with such recommendations. On average, respondents said fifty percent of the time. Among Republicans, the average was 52% and among Democrats 53%. Independents were less optimistic, with an average response of 41%.
After evaluating the positions, respondents were asked how they compared to their expectations of the recommendations that a representative panel of citizens would make. Overall, 51% said better than expected, 38% said about the same, and just 11% said worse.
Among partisans, only very small shares said the recommendations were worse than they 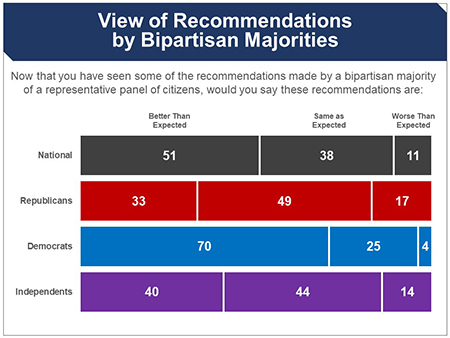 expected (Republicans 17%, Democrats 4%, independents 14%). However, there were some substantial partisan differences. The recommendations were rated as better than expected by a far greater percentage of Democrats (70%) than Republicans (33%) and independents (40%). About half of Republicans (49%) said the recommendations were the same as they expected, as did 44% of independents.
In 2018, when presented a different set of positions, a larger number (61%) said they were better than expected (Republicans 50%, Democrats 72%).
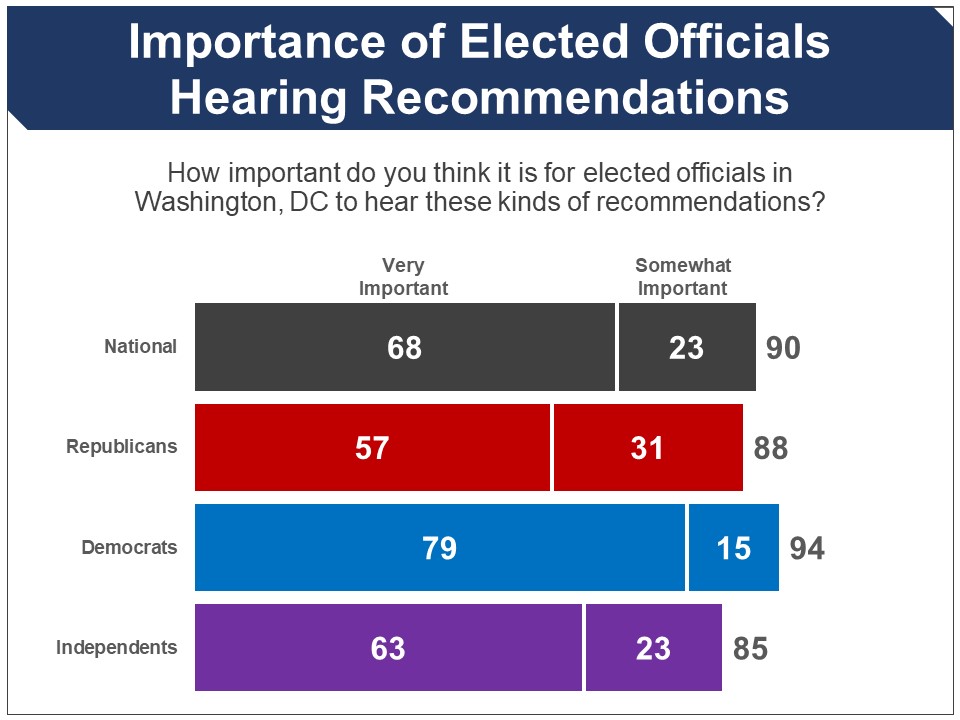
The Effect on Views of Public Consultation 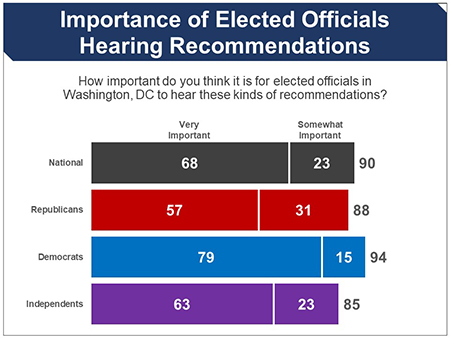 After evaluating the 67 positions, respondents were asked how important it is for elected officials in the federal government to hear those kinds of recommendations. A large bipartisan majority said very important (68%, Republicans 57%, Democrats 79%, independents 63%), and another 23% said somewhat important (Republicans 31%, Democrats 15%, independents 23%). Just 6% said just a little important, and a mere two percent said not important at all.
They were also asked how much influence such recommendations should have on elected officials’ decision making in Washington DC. Respondents could choose between: a lot, some, just a little, and no influence at all. An overwhelming and bipartisan majority of 83% said they should have at least some influence (a lot 47%, some 36%), including 79% of Republicans (a lot 39%) and 89% of Democrats, of whom a majority said a lot of influence (57%). Just 5% overall said no influence at all. 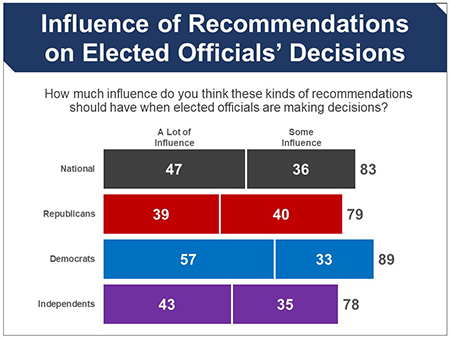 A key question is how the level of disagreement with the positions affects the level of influence that respondents believe such recommendations should have on elected officials. Overall, support for such recommendations having an influence was highly resilient. Among those who disagreed with just 10% of the positions or less, nine-in-ten said they should have at least some influence (a lot 59%). Even among those who disagreed with 50-55%, a large majority of 64% said at least some influence (a lot 19%). For those who disagreed with 56% or more of the recommendations, half said they should have at least some influence.
In 2018, when presented a different set of positions, similar majorities said it was very important for representatives to hear these kinds of recommendations (73%, Republicans 63%, Democrats 83%); and for such recommendations to have influence on elected officials’ decision making (84%, Republicans 79%, Democrats 88%).
What if a Committed Representative Does Not Follow Constituents’ Recommendations?
Respondents were presented the following scenario:
“Now imagine that the candidate who commits to consult a representative panel of their constituents is elected. Imagine that much of the time the new member votes consistent with the majority views of the panel of constituents. But then imagine sometimes on a key vote the new member votes contrary to the majority views of the panel of constituents and also contrary to your views.”
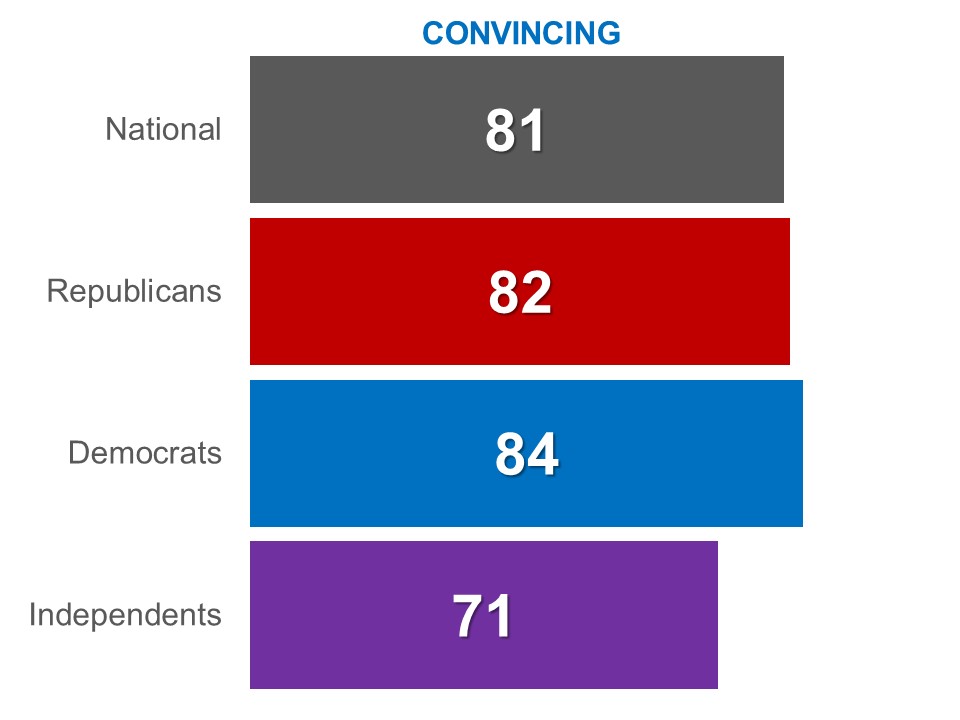
They were then offered three statements and asked “how much it is the way you would likely feel,” from a lot to not at all.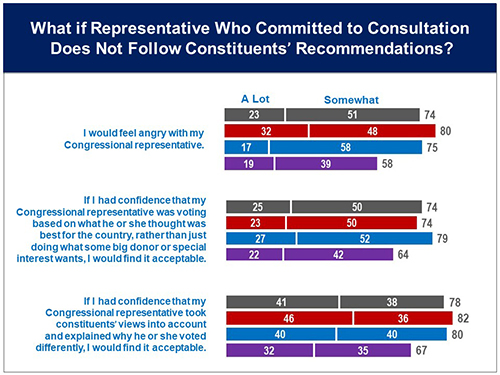 For the statement, “I would feel angry with my Congressional representative,” 74% said they would likely feel this way a lot (23%) or somewhat (51%), including eight-in-ten Republicans and three-quarters of Democrats. One-in-five said not much (Republicans 17%, Democrats 18%), and just 3% said not at all. Fewer independents, but still a majority (58%), said they agreed with the statement.
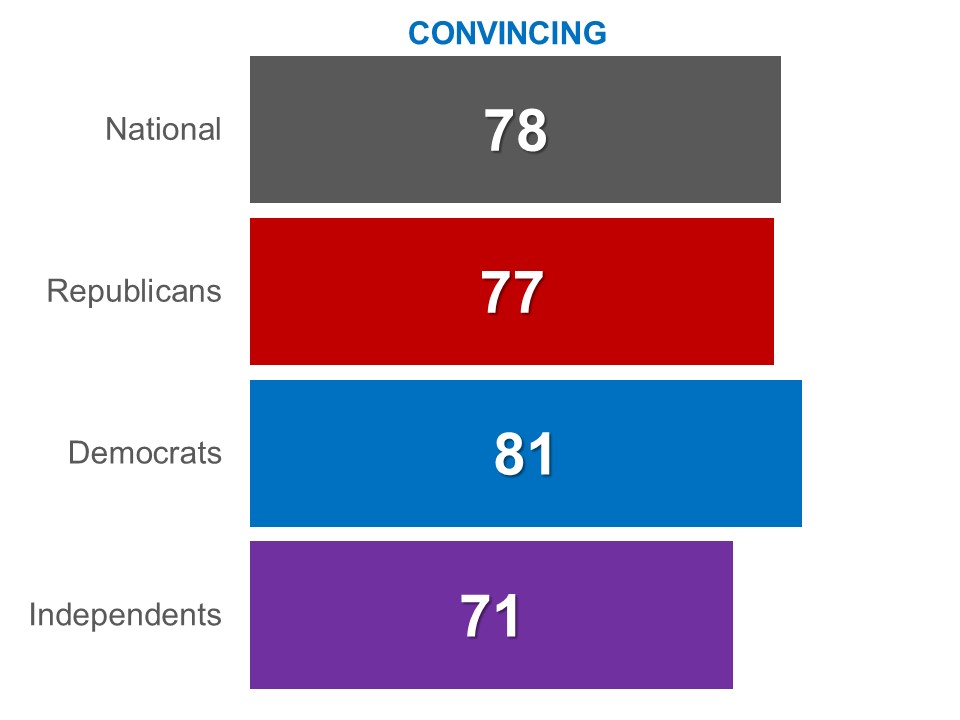
In response to the statement: “If I had confidence that my Congressional representative took the views of the [representative panel] into account and explained why he or she voted differently, I would find it acceptable,” three-in-four said they would likely feel this way (a lot 25%), with only minor partisan differences (Republicans 74%, Democrats 79%, independents 64%). Just five percent said not at all (Republicans 5%, Democrats 3%, independents 9%).
There were similar reactions to the statement “If I had confidence that my Congressional representative was voting based on what he or she really thought was best for the country, rather than just doing what some big donor or special interest wants, then I would find it acceptable.” Over three-in-four said they would likely feel this (78%, a lot 41%), with only minor partisan differences (Republicans 82%, Democrats 80%, independents 67%). Just six percent said not at all (Republicans 4%, Democrats 5%, independents 11%).